
Most teams assume GLP-1 tenders split evenly between originator and non-originator manufacturers. The awarded-bid data says otherwise—and the countries where the split is closest aren’t the ones most teams are watching. Here’s what the latest data shows, and what it means for anyone planning a market participation strategy.
The 72% Signal
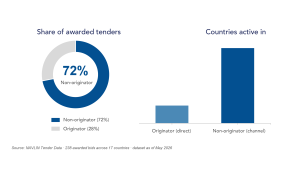
72% of awarded GLP-1 tender bids go to non-originators.
Selective direct participation can be a deliberate choice. Undocumented absence is an exposure.
Break it down by geography and the imbalance sharpens further: originator manufacturers bid direct in only 4 countries, while non-originators are active across 17. That gap is the headline. Nearly three-quarters of awarded volume is already flowing to non-originators, and the direct originator footprint hasn’t grown to match—which raises the question of whether that concentration is a strategic choice or simply where attention has been focused.
Where the Market Is Concentrated
Five markets account for more than two-thirds of awarded GLP-1 volume. Procurement activity is concentrated—not evenly distributed across the globe—and the lineup just changed.
| Market | Awarded Tenders |
|---|---|
| Poland | 54 |
| Brazil | 39 |
| Chile | 33 |
| Denmark | 22 |
| Italy | 18 |
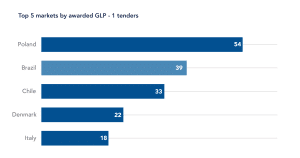
Poland remains the single largest market. Brazil sits in second place, ahead of Chile—39 awarded lots, zero originator wins. That’s not a rounding change; it’s a top-tier market built entirely on non-originator volume.
The picture is also far from settled—a large share of active tenders globally are still open or recently published. Today’s award data is a snapshot of a market still very much in motion, not a finished scoreboard.
Source: NAVLIN Tender Data · awarded contracts · 2024–2026
Competition Intensity Varies Sharply by Market
Awarded tenders don’t draw the same level of competition everywhere—some are fiercely contested; others are effectively uncontested volume plays.
Slovenia and South Korea sit at one extreme: many bidders chasing relatively few awards, which rewards a differentiated bid on price, service, or supply guarantees. Poland and Chile sit at the other extreme: high volumes of awarded contracts with comparatively little competition per tender, which rewards speed and reliable supply over differentiation.
| Market | Character |
|---|---|
| Slovenia | Highly contested |
| South Korea | Highly contested |
| Poland | Volume-driven |
| Chile | Volume-driven |
The practical implication: a single go-to-market playbook won’t work across both types of market. High-competition markets require a differentiated bid. High-volume markets reward speed and supply reliability—treating them the same way risks losing in the contested markets and over-investing in the volume ones.
Source: NAVLIN Tender Data · bidder-level award analysis · 2024–2026
Three Tender Models, Three Commercial Plays
The data sorts cleanly into three market archetypes, each requiring a different commercial response.
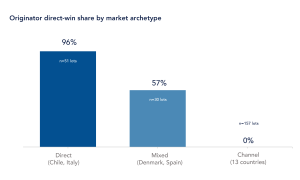
In Direct markets—Chile and Italy—originator manufacturers hold 96% of awarded share across 51 lots. That’s a position worth defending proactively, since payer relationships and brand equity erode without active engagement, not because a competitor forces the issue.
In Mixed markets—Denmark and Spain—the split is genuinely close to even: 57% direct across 30 lots. This is the one archetype worth watching closely, since it’s the clearest leading indicator for how a market behaves while an originator is still actively defending it.
In Channel markets—the other 13 countries in the dataset, including Poland and Brazil—originators have zero direct wins across 157 lots, and channel partners are consolidating. The strategic task isn’t to re-enter directly—it’s intelligence: understanding who is winning, and at what price, is a precondition for any future access strategy in these markets.
Source: NAVLIN Tender Data · market archetype classification, recalculated on full awarded-bid data · 2024–2026
The Molecule Preview: What Liraglutide Signals for Semaglutide
If GLP-1 tender dynamics are going to show up anywhere first, it’s in the molecule furthest along its competitive lifecycle—liraglutide, already years past loss of exclusivity in most markets.
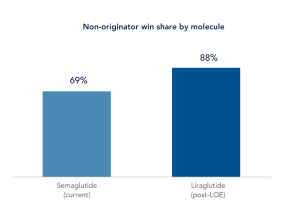
88% of liraglutide’s awarded tenders go to non-originators.
That’s higher than semaglutide’s 69% non-originator rate today—a preview of where the broader category is headed as more entrants compete for the same tenders.
In Chile, liraglutide now prices at parity with non-originator competitors—the clearest sign yet that once an originator stops defending price, the gap closes fast. In the Czech Republic, one tender was decided by a gap of just 0.24% between the winning bid and the runner-up—proof that in a converging market, pricing precision, not brand, decides who wins. Channel-led pricing collapses well below originator pricing wherever the originator steps back—a median 84% discount across the dataset overall. Full country-by-country and bidder-level pricing is reserved for the complete briefing.
When tender awards are decided on pricing dynamics like these, price intelligence stops being a nice-to-have reporting function and becomes a strategic capability.
Source: NAVLIN Tender Data · winner vs. runner-up price analysis · updated dataset, May 2026
The Model Choice: What You Protect, What It Costs
Underlying all of this is a single strategic question: is the participation model—direct originator vs. channel-led non-originator—being chosen deliberately, or defaulted into by procurement inertia? Each model preserves a different set of commercial assets and understanding that trade-off is a prerequisite for portfolio planning.
| Direct Originator | Channel-Led Non-Originator | |
|---|---|---|
| Reach | 4 countries | 17 countries |
| Median price/mg | $24.41 (Originator company) | $3.95 — an 84% discount |
| Best for | Brand control, payer relationship | Market speed, broader reach |
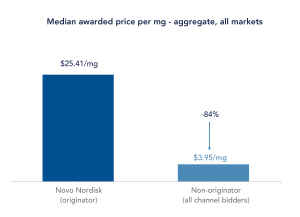
Neither model is free. Going direct protects brand control and the payer relationship but leaves limited visibility into markets where non-originators are winning. Going channel-led gains reach and faster participation but cedes relationship data and future leverage in that market.
The decision to bid directly, partner, or exit a given market should be made with full visibility of competitive dynamics—and made before the tender publishes, not in reaction to an award result.
Source: NAVLIN Tender Data · bidder classification analysis · 2024–2026
Want the Full Analysis?
This overview draws from a full GLP-1 market analysis and strategic frameworks for mature brand positioning. The complete briefing covers:
- GLP-1 market structure across 32+ countries
- Competitive intensity and price convergence by market—including full country- and bidder-level pricing
- A market-level participation decision framework
- Three strategic levers for originator margin defense
Source: NAVLIN GLP-1 Tender Intelligence · PPIC Basel 2026
Author


Gerardo leads the contract & tender solutions group within EVERSANA. In this role he helps build out data and insights around contract & tender processes and supports implementation of contracting solutions for EVERSANA clients…